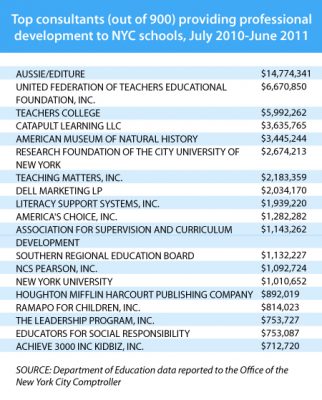
In total, New York City's public schools spent about $100 million on training for teachers and principals 2011 year.
| 2012 PISA test scores of public school and private school students | |||||||
| Reading | Math | Science | |||||
| Country | Category | % | Mean | Mean | Mean | ||
| United States of America | public | 93.01 | 497 | 482 | 498 | ||
| United States of America | private | 6.99 | 519 | 486 | 508 | ||
| OECD Total | public | 82.37 | 490 | 481 | 492 | ||
| OECD Total | private | 17.54 | 519 | 514 | 520 | ||
| OECD Average | public | 80.69 | 491 | 489 | 496 | ||
| OECD Average | private | 19.2 | 527 | 522 | 528 | ||
| OECD Total = OECD Total – (OECD as single entity) – each country contributes in proportion to the number of 15-year-olds enrolled in its schools | |||||||
| OECD Average – (country average) – mean data for all OECD countries – each country contributes equally to the average | |||||||
| Data generated from http://pisa2012.acer.edu.au | |||||||
Institute of Education Sciences
National Center for Education Statistics
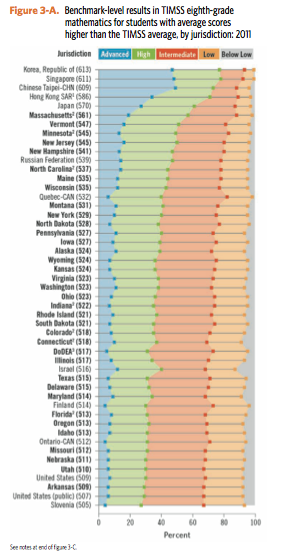
NCES initiated this special study in an effort to link the National Assessment of Educational Progress (NAEP) scale to the Trends in International Mathematics and Science Study (TIMSS) scale so that states could compare the performance of their students with that of students in other countries. The study was conducted in 2011 with eighth-grade students in all 52 states/jurisdictions that participated in the NAEP mathematics and science assessments. Read more about TIMSS.
Unclear where U.S. students stand in math and scienceI don’t know what to make of a long-awaited report issued Oct. 24, 2013 by the National Center of Education Statistics showing that most U.S. eighth grade students are not at the bottom of the global barrel when it comes to math and science. The study extrapolates what students in every state in the Union would have scored on an international test, the TIMSS, had they taken it, based on what they actually scored on the NAEP.


No comments:
Post a Comment